The history of Burning Man has always been a complex entity that has survived, nay, mutated over the years. And because of this, it has grown rapidly since its humble beginnings of a simple gathering on a beach.
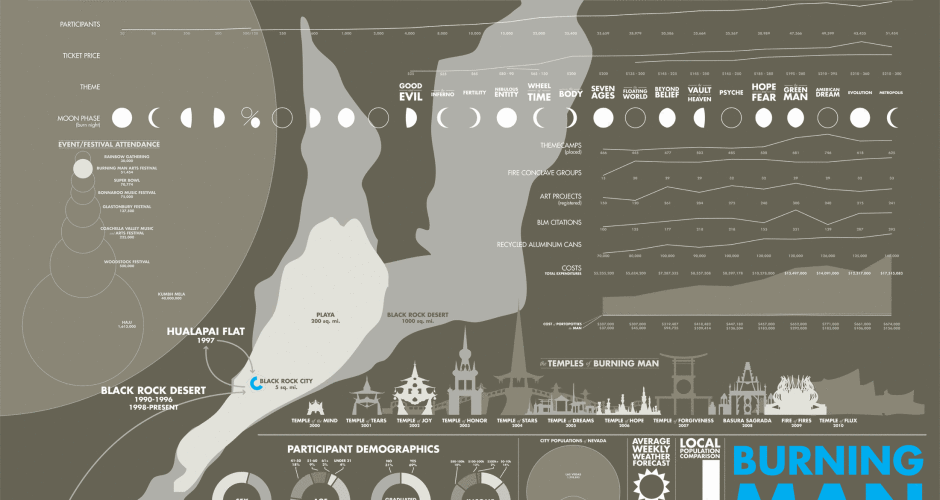
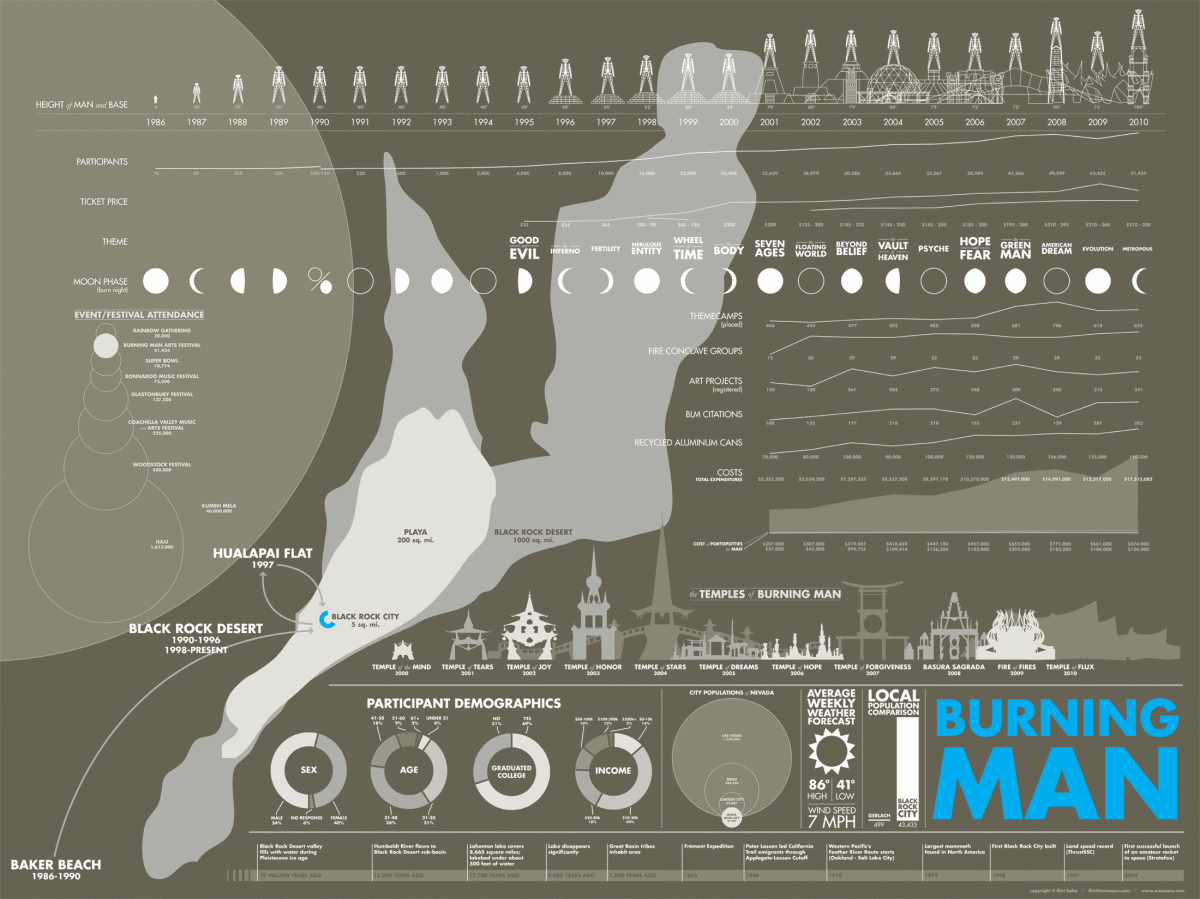
The infographic poster shows only a small portion of what Burning Man is. By no means do mere numbers even begin to show a complete picture, as that is a history of stories, experiences, and individual tales.
3′ x 4′
(view larger size for detail)
I was recently interviewed by Jordan Salinger from the San Francisco Planning and Urban Research Association about this inforgraphic:
“For some it is a yearly spiritual revival providing an emotionally charged respite from reality; for others it simply means they are able to eat brunch without standing in line. The mark left by Burning Man on San Franciscans and this city is undoubtedly immense, but is hard to truly measure. The same can be said about the impact on Black Rock City, Burning Man’s yearly home, but this stunning infographic provides an all-encompassing perspective on the event.”
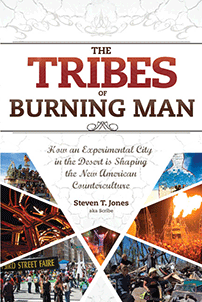
 The graphic was included as the lead-in image for the book The Tribes of Burning Man: How an Experimental City in the Desert Is Shaping the New American Counterculture by Steven T. Jones.
 Prominently displayed in the O’Reilly book Designing Data Visualizations: Representing Informational Relationships by Julie Steele and Noah Iliinksy with the following description, “Flint Hahn’s Burning Man infographic is a great example of an aesthetically rich, manually-drawn piece.”
Burning Man Infographic Medium Specifics
Adobe Illustrator
3’x4′


Leave a Reply